
Attainment, Progress and Value-Added: Three Numbers Schools Conflate
A student can be high-attaining and low-progress. A cohort can show strong progress and negative value-added. Those are not contradictions — they are three lenses, and conflating them produces reports that quietly say different things to different readers.
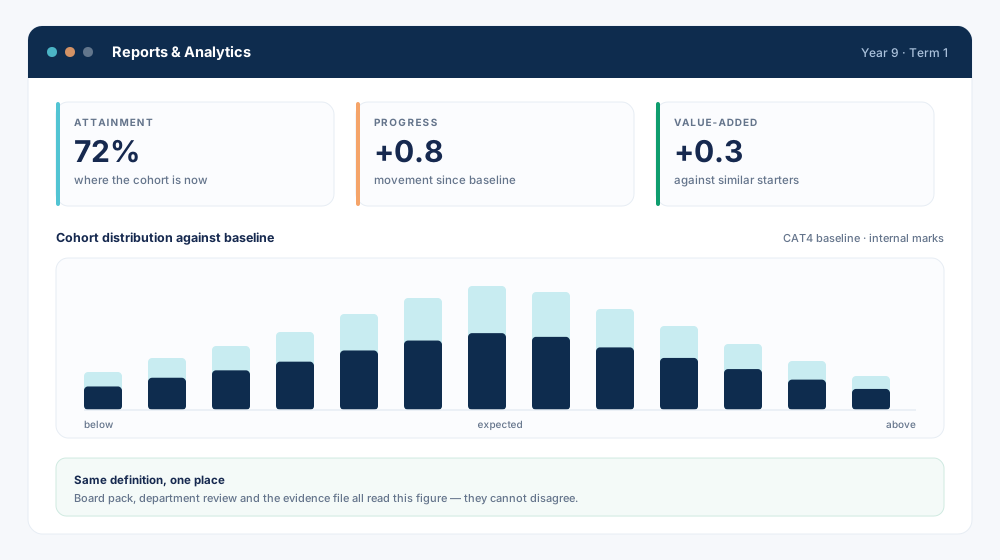
Three numbers get used interchangeably in school reporting, and they answer three different questions. A leadership team that has not separated them will eventually be asked to explain why two of its own reports disagree — and the honest answer, that nobody defined which number was being shown, is not one anyone wants to give.
The three questions
Attainment asks: where is this student now? It is a snapshot. A grade, a percentage, a band. It is the easiest of the three to produce and the least informative on its own, because it says nothing about where the student started.
Progress asks: how far has this student moved? It needs two points on the same student and a defensible statement about the distance between them. A school with one year of history cannot answer it at all.
Value-added asks: how far has this student moved compared with students who began in the same place? This is the only one of the three that isolates the school’s contribution, and it is the one that requires a reference point from outside the school.
A student can be high-attaining and low-progress. A cohort can show strong progress and negative value-added. Those are not contradictions. They are three lenses, and conflating them produces reports that quietly say different things to different readers.
Where the numbers drift apart
The disagreement is rarely arithmetic. It is definitional, and it usually enters in one of four places:
- Different baselines. One department measures from the start of the academic year, another from the previous report cycle. Both are defensible; together they are incomparable.
- Different cut-off dates. A mark entered on the Monday after the export appears in one report and not the other. Neither is wrong, and neither reader knows.
- Different treatment of joiners. A student who arrived in February has no September baseline. Including them with a substituted baseline flatters or damages the cohort figure depending on the substitution.
- Different weighting. If coursework counts for thirty per cent in one subject’s model and forty in another, an aggregated year-group figure is an average of two incompatible scales.
None of these are visible in the output. They are visible only in the method, which is why the reconciliation meeting is always longer than anyone budgets for.
Compute once, read everywhere
The structural fix is to define each measure once, in one governed model, and have every report read from it rather than recompute it. The board pack, the department review, the parent-facing report card and the evidence file then agree by construction rather than by reconciliation.
This is a data-architecture decision, not a reporting one. It has to be made before the reports are built, because a definition applied retrospectively cannot fix figures already circulated. Our reports and analytics module takes this approach: one definition per measure, one place it is computed, and drill-through from any number to the students behind it.
External reference points
Value-added needs something the school did not produce. In UAE schools the common reference points are standardised baseline and progress tests — CAT4, GL Progress Tests, NGRT, PASS and ACER IBT among them. Which a school uses matters less than that the results are held against internal marks in the same model rather than in a parallel spreadsheet.
The parallel spreadsheet is the failure mode. It works for one cycle, is maintained by one person, and produces a figure nobody else can reproduce. When that person is on leave during an inspection window, the school has the number but not the method.
What to check in your own reporting
Three questions will tell you quickly whether your three numbers are safe:
- If two reports quote a different figure for the same cohort, can you say why within a minute?
- Can a head of department reproduce the year-group value-added figure without asking anyone?
- Does a number on a leadership dashboard lead to the students behind it, or does it end there?
A school that answers yes three times has a reporting model. A school that does not has a set of exports that happen to agree this term. The difference shows up under scrutiny, and it shows up at exactly the moment there is no time to fix it.
Related reading: why maintained evidence beats reconstructed evidence covers the timeline problem that sits underneath all three measures, and the gradebook and assessment module is where the marks these figures are built from are entered once.
Frequently asked questions
Can a school report progress without external benchmarks?
Yes, but it is a weaker claim. Internal marks measured against themselves show movement; they cannot show whether that movement is typical for the cohort. External reference points turn a trend into a judgement someone else can check.
Why do the three numbers disagree between departments?
Almost always because each department computed its own, with its own baseline and its own cut-off date. The fix is not better spreadsheets. It is one definition, applied once, that every report reads from.
What is the minimum history needed before progress means anything?
Two comparable points on the same student. That is why mid-year migrations that leave history behind are so expensive: the school does not lose data so much as lose the ability to make any progress claim at all until a second point accumulates.
Keep reading
SEN Provision Mapping: What a Usable Map Holds
Most schools can produce a list of students on the inclusion register. Far fewer can produce what each of those students actually received last term, who delivered it, and whether it worked.
OperationsReport Week Is a Diagnostic, Not a Deadline
A report card contains almost nothing new. If marks, attendance and comments already sit in one place in a usable form, generating it is a print job. If they do not, report week is where the reconciliation finally happens.
BuyingHow to Choose a Student Information System in the UAE
Most SIS shortlists are built on feature checklists, and feature checklists are where schools get caught. The differences that matter here are structural, and they only surface if you ask about them directly.
See it against your own school
A walkthrough configured to your curriculum, run by someone who can answer migration questions rather than defer them.
Book a demo